Image Details
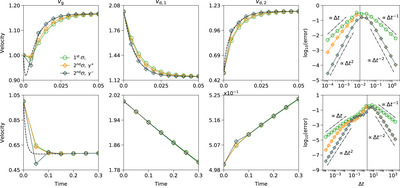
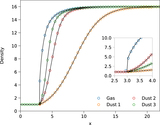
Caption: Figure 2.
From left to right, we plot the evolution of the velocity for the gas and two dust species. The dashed line corresponds to the analytical solution, given by Equation (39). The circles indicate the numerical solutions obtained with different integrators. Green color shows the first-order method, orange and dark lines the second-order method with ﹩\gamma ={\gamma }^{+}=1+1/\sqrt{2}﹩ and ﹩\gamma ={\gamma }^{-}=1-1/\sqrt{2}﹩, respectively. The upper and lower panels show the results for tests 1 and 2, respectively. In the top and bottom panels, the time step is Δt 1 = 0.005, Δt 2 = 0.05, respectively (see Section 3.1). In the rightmost panel, we plot the error by Equation (40) as a function of the time step Δt, for the first-order method (green color) and the DIRK method with ﹩\gamma =1\pm 1/\sqrt{2}﹩. The vertical solid line corresponds to Δt = t s,max, where condition (18) is applied for the DIRK method.
Other Images in This Article
Copyright and Terms & Conditions
© 2024. The Author(s). Published by the American Astronomical Society.