Image Details
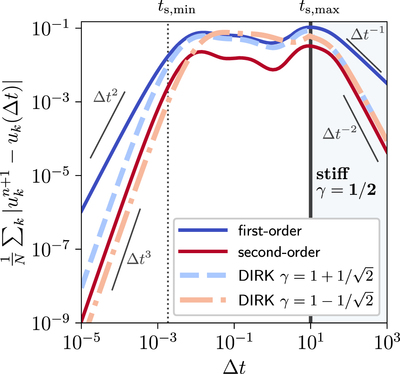
Caption: Figure 1.
Comparison of the (local) truncation error for different methods described in Section 2.1. The blue solid line corresponds to the first-order implicit method of Equation (12), whereas the red solid line shows the error for the second-order implicit method of Equation (13). The solutions obtained with the DIRK method are shown in blue and red dashed lines. The black solid line indicates the transition to a stiff regime, where γ is set to γ = 1/2 for the DIRK method. For Δt ≳ 0.002 (vertical dotted line) time-explicit methods will be unstable. The analytical solution, u k (Δt), is obtained by solving the eigenvalue problem of the linear Equation (11).
Other Images in This Article
Copyright and Terms & Conditions
© 2024. The Author(s). Published by the American Astronomical Society.