Image Details
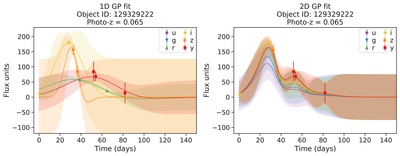
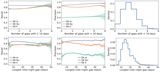
Caption: Figure 2.
SN Ibc light curve, where the points show the observations, along with their error bars, and the lines and the shaded regions show the mean and standard deviation of the GP fit, respectively. The left panel shows the one-dimensional GP fit to each available passband, and the right panel shows the two-dimensional GP fit to all of the passbands (shown in different colors). The two-dimensional GP infers the light curve in passbands where there are no (or few) observations, unlike the one-dimensional GP.
Other Images in This Article
Show More
Copyright and Terms & Conditions
© 2022. The Author(s). Published by the American Astronomical Society.
Copyright ©
2025 Astronomy Image Explorer. All Rights Reserved.