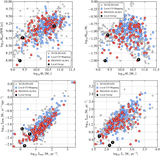
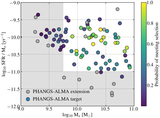
Image Details

Choose export citation format:

PHANGS–ALMA: Arcsecond CO(2–1) Imaging of Nearby Star-forming Galaxies

  • Authors: Adam K. Leroy, Eva Schinnerer, Annie Hughes, Erik Rosolowsky, Jérôme Pety, Andreas Schruba, Antonio Usero, Guillermo A. Blanc, Mélanie Chevance, Eric Emsellem, Christopher M. Faesi, Cinthya N. Herrera, Daizhong Liu, Sharon E. Meidt, Miguel Querejeta, Toshiki Saito, Karin M. Sandstrom, Jiayi Sun, 嘉 懿 孙, Thomas G. Williams, Gagandeep S. Anand, Ashley T. Barnes, Erica A. Behrens, Francesco Belfiore, Samantha M. Benincasa, Ivana Bešlić, Frank Bigiel, Alberto D. Bolatto, Jakob S. den Brok, Yixian Cao, Rupali Chandar, Jérémy Chastenet, I-Da Chiang, 宜 達 江, Enrico Congiu, Daniel A. Dale, Sinan Deger, Cosima Eibensteiner, Oleg V. Egorov, Axel García-Rodríguez, Simon C. O. Glover, Kathryn Grasha, Jonathan D. Henshaw, I-Ting Ho, Amanda A. Kepley, Jaeyeon Kim, Ralf S. Klessen, Kathryn Kreckel, Eric W. Koch, J. M. Diederik Kruijssen, Kirsten L. Larson, Janice C. Lee, Laura A. Lopez, Josh Machado, Ness Mayker, Rebecca McElroy, Eric J. Murphy, Eve C. Ostriker, Hsi-An Pan, Ismael Pessa, Johannes Puschnig, Alessandro Razza, Patricia Sánchez-Blázquez, Francesco Santoro, Amy Sardone, Fabian Scheuermann, Kazimierz Sliwa, Mattia C. Sormani, Sophia K. Stuber, David A. Thilker, Jordan A. Turner, Dyas Utomo, Elizabeth J. Watkins, Bradley Whitmore

Adam K. Leroy et al 2021 The Astrophysical Journal Supplement Series 257 .

  • Provider: AAS Journals

Caption: Figure 18.

PHANGS–ALMA on the star-forming main sequence and size–mass relation. PHANGS–ALMA targets in SFR–M and R eM space. PHANGS–ALMA targets appear as red hexagons. For comparison, galaxies observed as part of the xCOLD GASS survey are represented by blue squares (Saintonge et al. 2017). We show a large sample of local galaxies as gray dots. In the SFR–M space these are all galaxies with d < 50 Mpc and measurements from Leroy et al. (2019). In the lower panel, we combined masses from Leroy et al. (2019) with sizes from Muñoz-Mateos et al. (2015), with the latter being the limiting quantity. Black lines show scaling relations relevant to late-type galaxies. In the top panel we show the star-forming main sequence as a solid black line, with the specific formula from Leroy et al. (2019). In the bottom panel we show the r-band result for late-type galaxies from Lange et al. (2015). We show the distribution of offsets from both relations in Figure 17.

Other Images in This Article

Show More

Copyright and Terms & Conditions

Additional terms of reuse