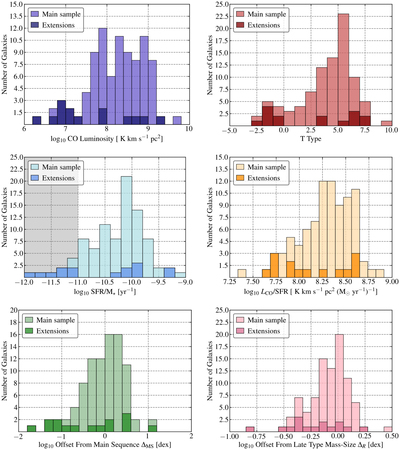
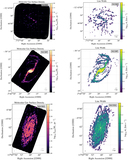
Image Details

Choose export citation format:

PHANGS–ALMA: Arcsecond CO(2–1) Imaging of Nearby Star-forming Galaxies

  • Authors: Adam K. Leroy, Eva Schinnerer, Annie Hughes, Erik Rosolowsky, Jérôme Pety, Andreas Schruba, Antonio Usero, Guillermo A. Blanc, Mélanie Chevance, Eric Emsellem, Christopher M. Faesi, Cinthya N. Herrera, Daizhong Liu, Sharon E. Meidt, Miguel Querejeta, Toshiki Saito, Karin M. Sandstrom, Jiayi Sun, 嘉 懿 孙, Thomas G. Williams, Gagandeep S. Anand, Ashley T. Barnes, Erica A. Behrens, Francesco Belfiore, Samantha M. Benincasa, Ivana Bešlić, Frank Bigiel, Alberto D. Bolatto, Jakob S. den Brok, Yixian Cao, Rupali Chandar, Jérémy Chastenet, I-Da Chiang, 宜 達 江, Enrico Congiu, Daniel A. Dale, Sinan Deger, Cosima Eibensteiner, Oleg V. Egorov, Axel García-Rodríguez, Simon C. O. Glover, Kathryn Grasha, Jonathan D. Henshaw, I-Ting Ho, Amanda A. Kepley, Jaeyeon Kim, Ralf S. Klessen, Kathryn Kreckel, Eric W. Koch, J. M. Diederik Kruijssen, Kirsten L. Larson, Janice C. Lee, Laura A. Lopez, Josh Machado, Ness Mayker, Rebecca McElroy, Eric J. Murphy, Eve C. Ostriker, Hsi-An Pan, Ismael Pessa, Johannes Puschnig, Alessandro Razza, Patricia Sánchez-Blázquez, Francesco Santoro, Amy Sardone, Fabian Scheuermann, Kazimierz Sliwa, Mattia C. Sormani, Sophia K. Stuber, David A. Thilker, Jordan A. Turner, Dyas Utomo, Elizabeth J. Watkins, Bradley Whitmore

Adam K. Leroy et al 2021 The Astrophysical Journal Supplement Series 257 .

  • Provider: AAS Journals

Caption: Figure 17.

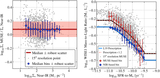
Histograms showing PHANGS–ALMA sample properties. The top row shows CO luminosity (Section 4.6) and morphological T-type code from HyperLEDA (Paturel et al. 2003; Makarov et al. 2014). The middle row shows the ratio of SFR to M , i.e., the specific star formation rate, and the ratio of L CO to SFR, which can be scaled by α CO to calculate the molecular gas depletion time. The bottom row shows offsets from two scaling relations: the SFR–M “star-forming main sequence” and the mass–size relation. Aperture corrections have been applied to the L CO estimates used in the plots (Section 4.6.1). In panels relevant to sample selection, gray shading marks the region excluded by the main sample selection (Section 3). Note that our best estimates of each quantity have improved since selection, so that we selected some galaxies that we now believe miss the selection criteria. The darker histogram shows properties of galaxies in survey extensions that focus on early-type and very nearby galaxies.

Other Images in This Article

Show More

Copyright and Terms & Conditions

Additional terms of reuse