Image Details
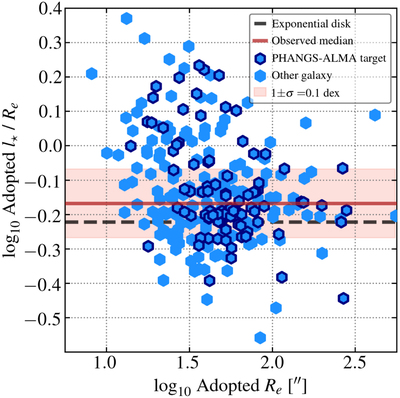
Caption: Figure 11.
Scale length and effective radius. The fit exponential scale length, l ⋆, divided by the effective radius, R e, measured from the same profile. The black dashed line shows expectations for a pure exponential disk (Equation (4)). Points above this line show some central concentration compared to a pure exponential disk, and this central concentration drives R e to smaller values. The l ⋆ fits should better capture the exponential portion of the profile. The axes are correlated, and the detailed trend is less important than the qualitative point: that many galaxies with small R e have bright nuclear concentrations, and that the fit l ⋆ indicates a much larger disk in some of these cases. That larger l ⋆ will be the relevant quantity for disk structure calculations or metallicity gradient estimation.
Other Images in This Article
Show More
Copyright and Terms & Conditions
© 2021. The American Astronomical Society. All rights reserved.