Image Details
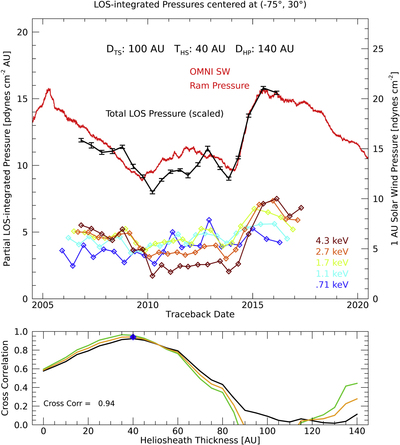
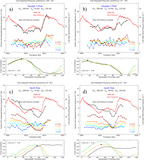
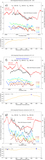
Caption: Figure 4.
(Top) Partial and total LOS-integrated plasma pressure in the HS vs. trace-back time (Equation (1)) for the macropixel centered at (−75°, 30°). This is for the case of a TS distance of 100 au and a best-fit HS thickness of 35 au, leading to an HP distance of 135 au. The partial LOS-integrated pressures (colored curves) are derived using Equation (3), and the total LOS-integrated pressure (black curve) is calculated from the partial pressures (Equation (2)) for the range where the trace-back times for all five ESA steps overlap. Also shown is the 1 au SW dynamic pressure calculated from the OMNI data set (red line) plotted at the actual time of observation. Statistical uncertainty error bars (1σ) are shown on the total pressure points. For clarity, they are not shown on the partial pressures. (Bottom) The choice of trace-back times shown in the top panel is based on varying the HS thickness between zero and 140 au. For each choice of HS thickness, the cross-correlation coefficient is calculated for the entire time series of flux measurements (black line) and only the last 5 yr (green line) in order to emphasize the correlation with the rapid increase in pressure observed at 1 au in 2014. The orange line is the arithmetic mean of the two. The blue diamond indicates the best correlation coefficient and therefore the best-fit HS thickness.
Other Images in This Article
Show More
Copyright and Terms & Conditions
© 2021. The American Astronomical Society. All rights reserved.