Image Details
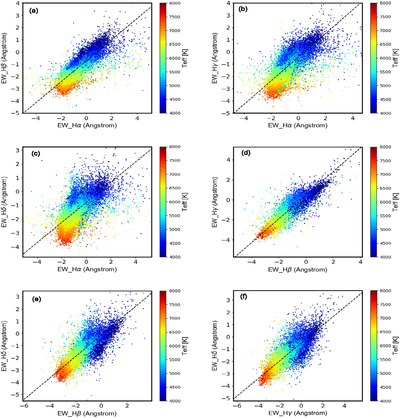
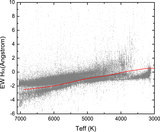
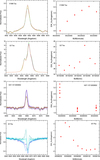
Caption: Figure 18.
EW relations between different Balmer lines as variables. The black dashed line in each panel denotes the fitted line. The color bar in each panel represents the effective temperature.
Other Images in This Article
Show More
Copyright and Terms & Conditions
© 2021. The American Astronomical Society. All rights reserved.
Copyright ©
2026 Astronomy Image Explorer. All Rights Reserved.