Image Details
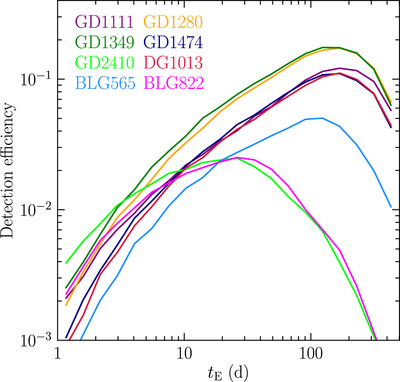
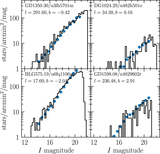
Caption: Figure 5.
Examples of detection efficiency curves. Fields GD2410 and BLG822 have been observed for less than 500 days and so sensitivity to long-timescale events in these fields is low. The detection efficiency curves have different normalizations, because the analyzed fields were observed for different lengths of time. (The detection efficiencies measured in our simulations have been multiplied by a factor of (tmax−tmin)/ΔT, where tmin and tmax are moments of the first and last observation of a given field and ΔT = 2650 days is the duration of the survey.)
Other Images in This Article
Copyright and Terms & Conditions
© 2020. The American Astronomical Society. All rights reserved.
Copyright ©
2025 Astronomy Image Explorer. All Rights Reserved.