Image Details
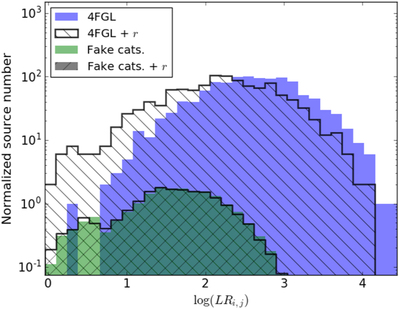
Caption: Figure 3.
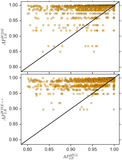
Distribution of the ﹩\mathrm{log}({\mathrm{LR}}_{i,j})﹩ for the crossmatches between WIBRaLS and 4FGL (Greal) is shown in blue; the average distribution for the crosmatches between WIBRaLS and the fake γ-ray catalogs (﹩\langle {G}_{\mathrm{fake}}\rangle ﹩) is shown in green. The hatched histograms represent the same distributions when taking angular separation, r, into account with the exponential behavior shown in Equation (1).
Other Images in This Article
Copyright and Terms & Conditions
© 2020. The American Astronomical Society. All rights reserved.
Copyright ©
2025 Astronomy Image Explorer. All Rights Reserved.