Image Details
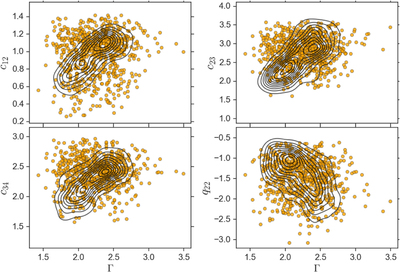
Caption: Figure 1.
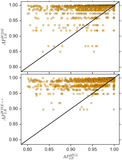
Training sample for the RF algorithm. The contours represent the distribution of the 869 high-confidence associations, while the orange dots represent the fake associations. The spectral parameters for the training sample are shown in terms of the γ-ray photon index, Γ; the three MIR colors, c12, c23, and c34 (as defined in the last paragraph of Section 1); and the MIR radio-loudness, q22.
Other Images in This Article
Copyright and Terms & Conditions
© 2020. The American Astronomical Society. All rights reserved.
Copyright ©
2025 Astronomy Image Explorer. All Rights Reserved.