Image Details
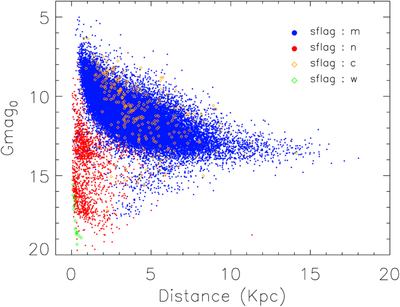
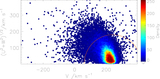
Caption: Figure 10.
Dereddened Gmag vs. distance diagram for all M giants in our catalog. The colors represent the different subsamples discussed in Section 3. For most of the confirmed M giants, the distance is between 1 and 15 kpc, with a peak at 2.5 kpc. Taking into account the intrinsic luminosities of the different subsamples, the distance distribution of each subsample is consistent with expectations.
Other Images in This Article

Copyright and Terms & Conditions
© 2019. The American Astronomical Society. All rights reserved.
Copyright ©
2026 Astronomy Image Explorer. All Rights Reserved.