Image Details
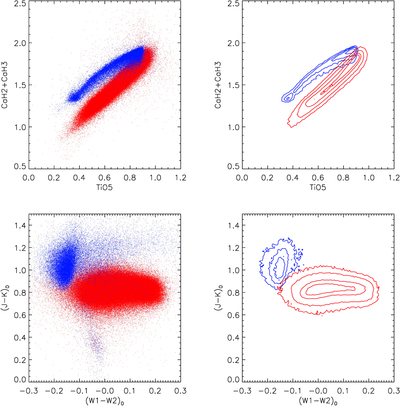
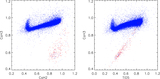
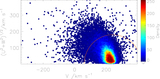
Caption: Figure 1.
Spectral indices diagram (top panels) and dereddened color–color diagram (bottom panels) of all M-type stars. Point distributions are plotted on the left, while corresponding contours are plotted on the right. The blue and red colors represent M giants and M dwarfs, respectively. As expected, M giants and M dwarfs show different distributions both in the spectroscopic parameter space as well as in the photometric parameter space.
Other Images in This Article
Copyright and Terms & Conditions
© 2019. The American Astronomical Society. All rights reserved.
Copyright ©
2024 Astronomy Image Explorer. All Rights Reserved.