Image Details
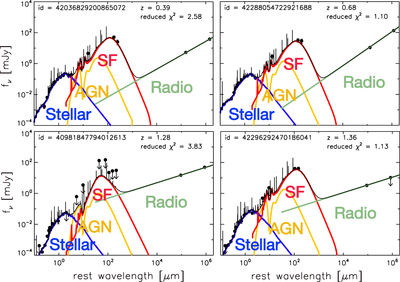
Caption: Figure 5.
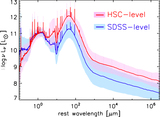
Examples of the SED (flux density as a function of wavelength in rest frame) and result of the SED fitting for our sample. The black points are photometric data where the down arrows mean 3σ upper limit. The blue, yellow, red, and green lines show stellar, AGN, SF, and radio component, respectively. The black solid lines represent the resultant SEDs. We provide best-fit SEDs for all 1056 HSC–FIRST RGs with derived physical properties (see Tables 3 and 4).
Other Images in This Article

Show More
Copyright and Terms & Conditions
© 2019. The American Astronomical Society. All rights reserved.
Copyright ©
2024 Astronomy Image Explorer. All Rights Reserved.