Image Details
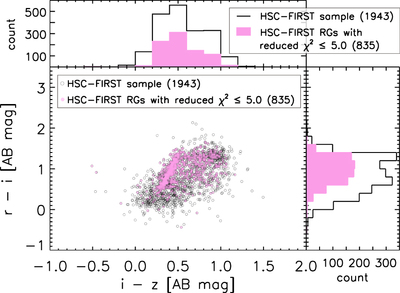
Caption: Figure 10.
Color–color diagram of r − i and i − z. The 1943 HSC–FIRST RG sample, and 835 RGs whose physical properties are studied in this work, are shown in black and magenta circles, respectively. Histogram of each color is also shown with solid lines (an entire sample of 1943 objects) and magenta-shaded regions (a subsample of 835 objects).
Other Images in This Article

Show More
Copyright and Terms & Conditions
© 2019. The American Astronomical Society. All rights reserved.
Copyright ©
2024 Astronomy Image Explorer. All Rights Reserved.