Image Details
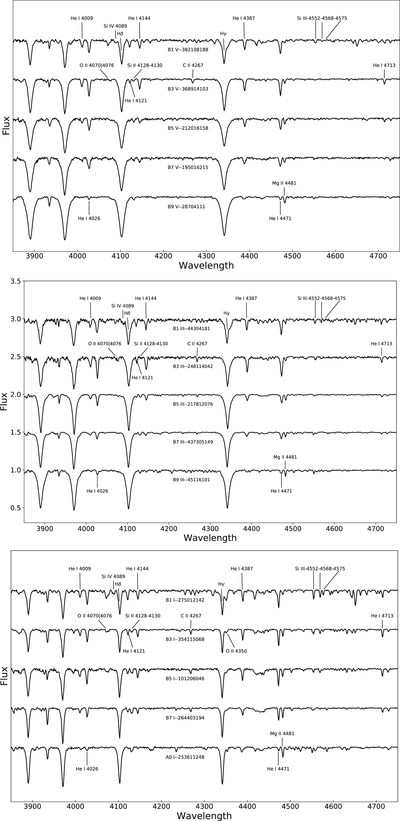
Caption: Figure 13.
Panels from top to bottom show the sequence of the manually classified luminosity classes, i.e., V, III, and I, respectively. The sequence of manually classified spectral subtypes for sample spectra are displayed in each panel. The corresponding spectral subtypes, luminosity classes, and the obsid (the ID of a spectrum in the LAMOST catalog) are marked under the corresponding spectra. Important line features are marked in the plots.
Other Images in This Article
Show More
Copyright and Terms & Conditions
© 2019. The American Astronomical Society. All rights reserved.
Copyright ©
2026 Astronomy Image Explorer. All Rights Reserved.