Image Details
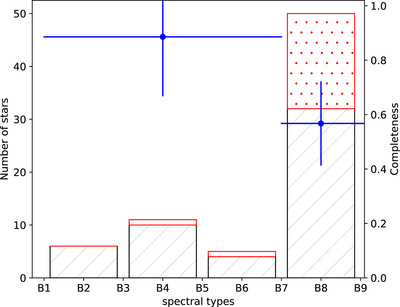
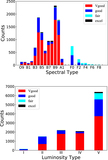
Caption: Figure 5.
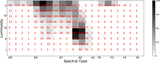
Black and red histograms show the distribution of spectral subtypes for the identified and missed OB stars, respectively, in the arbitrarily selected 5000 spectra. The two blue dots align with the right hand-side y-axis, which indicate the completeness of the selection criteria. The left blue dots indicate the completeness for the stars earlier than B7, while the right one indicates the completeness for the stars later than B7.
Other Images in This Article
Show More
Copyright and Terms & Conditions
© 2019. The American Astronomical Society. All rights reserved.
Copyright ©
2026 Astronomy Image Explorer. All Rights Reserved.