Image Details
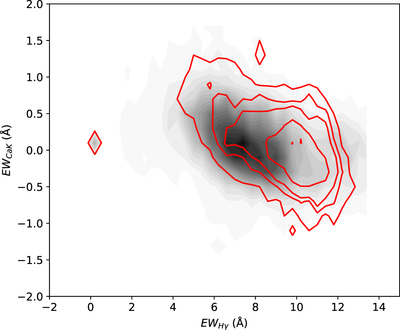
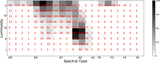
Caption: Figure 11.
Gray shadow displays the distribution of Ca II K vs. Hγ for the stars with successful classifications in MKCLASS. The red contours indicate the similar distribution for the stars with discrepant classifications in MKCLASS.
Other Images in This Article
Show More
Copyright and Terms & Conditions
© 2019. The American Astronomical Society. All rights reserved.
Copyright ©
2026 Astronomy Image Explorer. All Rights Reserved.