Image Details
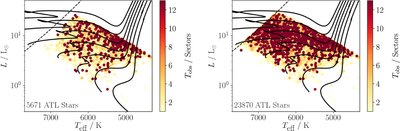
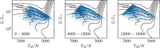
Caption: Figure 9.
H–R diagram of all ATL stars with detection probabilities greater than 50% with (left panel) and without (right panel) including the β factor, which accounts for the attenuation of oscillation amplitudes toward the red edge of the instability strip (dashed line). Solid lines show solar metallicity evolutionary tracks with masses from 0.8 M⊙ to 2.0 M⊙ in steps of 0.2 M⊙. Note that the sharp edges are due to cuts at the red edge of the instability strip (Equation (3)) and stars oscillating with frequencies accessible with TESS FFI data (Equation (4)).
Other Images in This Article

Copyright and Terms & Conditions
© 2019. The American Astronomical Society. All rights reserved.
Copyright ©
2026 Astronomy Image Explorer. All Rights Reserved.