Image Details
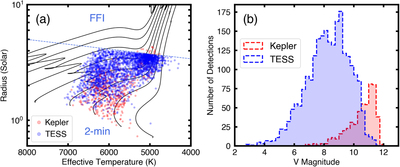
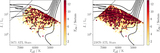
Caption: Figure 11.
Predicted asteroseismic yield for the first year of TESS science operations (Cycle 1). Panel (a): radius vs. effective temperature for all expected TESS detections (blue) and the detections for dwarfs and subgiants by Kepler (red). The blue dashed line marks the approximate radius limit above that oscillations can be confidently detected using FFI light curves. Black lines show evolutionary tracks. Panel (b): approximate V magnitude distribution of the expected TESS yield (blue) and the Kepler yield (red).
Other Images in This Article

Copyright and Terms & Conditions
© 2019. The American Astronomical Society. All rights reserved.
Copyright ©
2024 Astronomy Image Explorer. All Rights Reserved.