Image Details
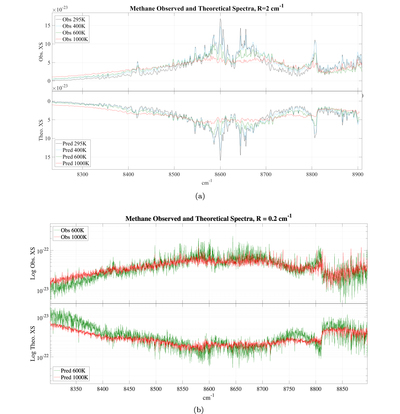
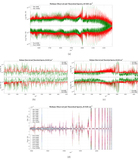
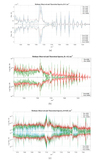
Caption: Figure 7.
Panel (a): an overview of the T-dependence of methane absorption cross sections (cm2/molecule) in the triacontad range at four temperatures 295, 400, 600, and 1000 K: low-resolution (R = 2 cm−1) simulations of observations (up) and theory (down). Panel (b): log-scale comparison of observed (up) and theoretical (down) methane absorption X-sections at the triacontad range for two temperatures T = 600 K (green) and 1000 K (red): medium-resolution (R = 0.2 cm−1) simulations.
Other Images in This Article

Copyright and Terms & Conditions
© 2019. The American Astronomical Society. All rights reserved.
Copyright ©
2025 Astronomy Image Explorer. All Rights Reserved.