Image Details
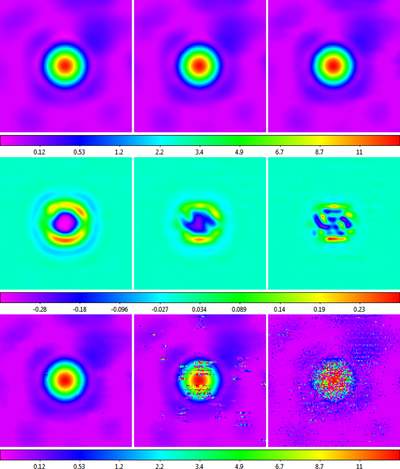
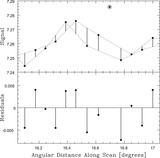
Caption: Figure 47.
Top row: background- and RFI-subtracted data from the right panel of Figure 43 surface-modeled with fixed weighting scales θw = 2/3 (left), 1/2 (middle), and 1/3 (right) beamwidths and zoomed in on the source. Square-root scaling is used to emphasize fainter structures. Middle row: surface models from the top row, at the locations of the background- and RFI-subtracted data (1) minus these data (residuals) and (2) re-surface-modeled for visualization. These weighting scales underestimate the peak of the source, but only by ≈4%, ≈2%, and <1%, respectively, and overestimate the base of the source, corresponding to additional blurring of the source, but only by ≈1%, ≈1/2%, and <1/4%, respectively. Weighting scales θw < 1/3 beamwidths serve only to better visualize sub-Nyquist scale structures, such as contaminants. Bottom row: same as the top row, but with fixed weighting scales θw = 1/6, 1/9, and 1/12 beamwidths. These weighting scales are too small (i.e., θw is sufficiently smaller than ﹩4/3\times {\theta }_{\mathrm{gap}}\approx 4/3\times 1/5﹩ beamwidths = 0.27 beamwidths) that the surface model is not always well constrained between data points.
Other Images in This Article


Show More
Copyright and Terms & Conditions
© 2019. The American Astronomical Society. All rights reserved.