Image Details
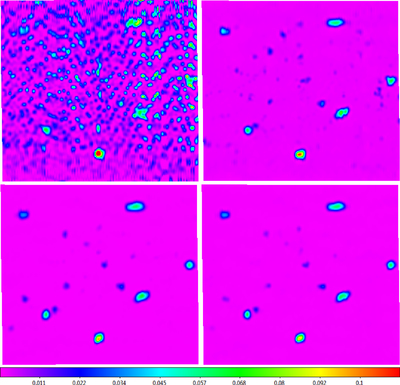
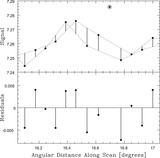
Caption: Figure 39.
Top left: background-subtracted mapping of, from right to left, 3C 84, NRAO 1560/1650, 3C 111, 3C 123, 3C 139.1, and 3C 147, as well as fainter sources, acquired with the 40 ft in the L-band using a maximum slew speed nodding pattern. The data are heavily contaminated by linearly polarized, broadband RFI, affecting only one of the receiver’s two polarization channels. Top right: data from the top-left panel time-delay corrected and RFI-subtracted, with a 0.7 beamwidth scale (Table 2). Bottom left: identically processed data from the receiver’s other, relatively uncontaminated polarization channel for comparison. The RFI-subtraction algorithm is not perfect, but performs very well given the original, extreme level of contamination. Bottom right: background-subtracted and time-delay-corrected data from both, equally calibrated polarization channels first appended and then jointly RFI-subtracted. Locally modeled surfaces have been applied for visualization (Section 1.2.1; see Section 3.7).
Other Images in This Article


Show More
Copyright and Terms & Conditions
© 2019. The American Astronomical Society. All rights reserved.