Image Details
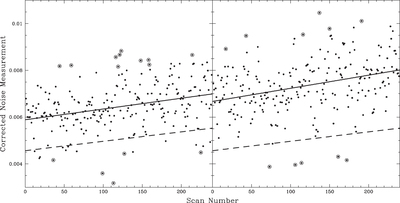
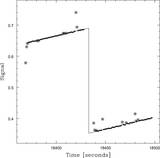
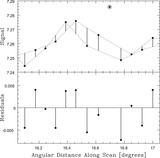
Caption: Figure 30.
Left: corrected 2D noise measurements vs. scan number for the 20 m observation from Figure 10, after background-subtracting on a 6 beamwidth scale, and the best-fit model (solid line). Circled points have been robust-Chauvenet rejected. 1D noise model from Figure 10 is included for comparison (dashed line). The 2D noise level is ≈28% higher, due to residual 1D structures (e.g., residual en-route drift) post-background subtraction. Right: same, but with a 24 beamwidth background-subtraction scale. In this case, the 2D noise level is ≈46% higher than the 1D noise level, because contaminants are less completely eliminated on longer background-subtraction scales (e.g., Figure 20).
Other Images in This Article


Show More
Copyright and Terms & Conditions
© 2019. The American Astronomical Society. All rights reserved.