Image Details
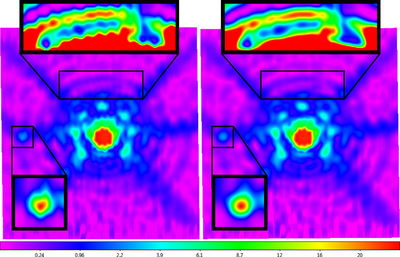
Caption: Figure 26.
Background-subtracted map of the Sun in the L-band, highlighting the 40 ft’s diffraction pattern, before (left) and after (right) time-delay correction. The center is saturated. Taurus A is to the left. The time-delay correction is most noticeable in the Airy rings (e.g., top zoom) and in (unsaturated) sources (e.g., left zoom). Locally modeled surfaces (Section 1.2.1; see Section 3.7) have been applied for visualization only. Square-root scaling is used to emphasize fainter structures.
Other Images in This Article


Show More
Copyright and Terms & Conditions
© 2019. The American Astronomical Society. All rights reserved.
Copyright ©
2025 Astronomy Image Explorer. All Rights Reserved.