Image Details
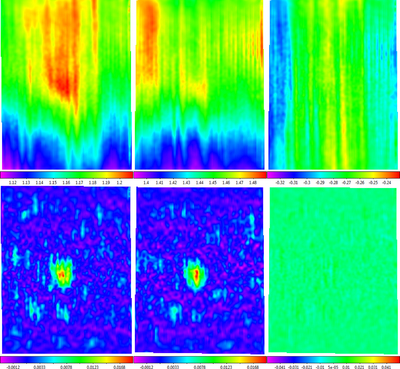
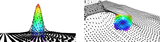
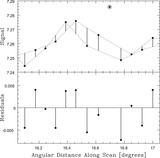
Caption: Figure 24.
Top row: (time-delay-corrected; see Section 3.4) raw maps of Andromeda (left and middle), acquired with the 40 ft in the L-band, using a maximum slew speed nodding pattern, and their difference (right). Instrumental signal drift dominates each map. Bottom row: data from the top row background-subtracted (left and middle), with a 5 beamwidth scale (larger than the minimum recommended scale from Table 1, given the size of the source), and their difference (right; spanning the same scale range as above). Similar maps are extracted, despite the large systematics. Locally modeled surfaces (Section 1.2.1; see Section 3.7) have been applied for visualization only.
Other Images in This Article

Show More
Copyright and Terms & Conditions
© 2019. The American Astronomical Society. All rights reserved.