Image Details
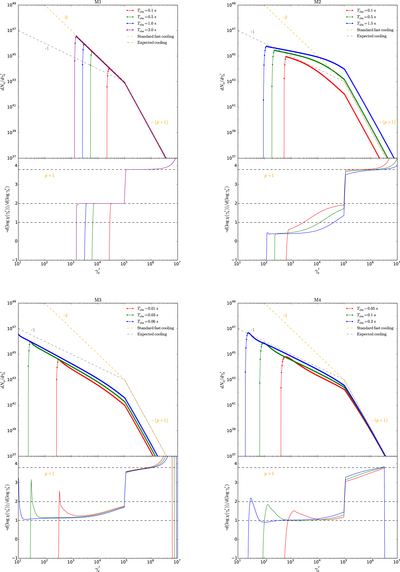
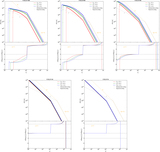
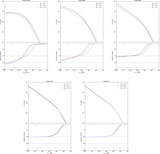
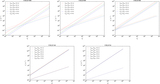
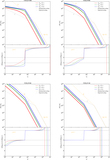
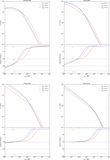
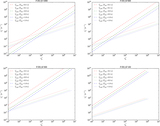
Caption: Figure 1.
Evolution of the electron energy spectrum for four cases in the testing calculations (see Table 1). The orange dashed lines are the standard fast-cooling pattern, i.e., ﹩{{dN}}_{{\rm{e}}}/d{\gamma }_{{\rm{e}}}^{{\prime} }\propto {\gamma }_{{\rm{e}}}^{{\prime} -2}﹩, and the gray dashed lines present the expected cooling pattern according to the observations, i.e., ﹩{{dN}}_{{\rm{e}}}/d{\gamma }_{{\rm{e}}}^{{\prime} }\propto {\gamma }_{{\rm{e}}}^{{\prime} -1}﹩. The epochs shown for each case are different, since the electron-cooling timescales are different. The lower panel of each case is the negative spectral index of the electron spectrum, i.e., ﹩\chi ({\gamma }_{{\rm{e}}}^{{\prime} })={{dN}}_{{\rm{e}}}/d{\gamma }_{{\rm{e}}}^{{\prime} }﹩. In the standard calculation, M1, the electron spectrum shows a typical broken power-law profile, with the spectral indices being ﹩-(p+1)﹩ above and −2 below ﹩{\gamma }_{{\rm{m}}}^{{\prime} }﹩. In other cases, the spectral indices below ﹩{\gamma }_{{\rm{m}}}^{{\prime} }﹩ are notably harder than −2.
Other Images in This Article
Show More
Copyright and Terms & Conditions
© 2018. The American Astronomical Society. All rights reserved.