Image Details
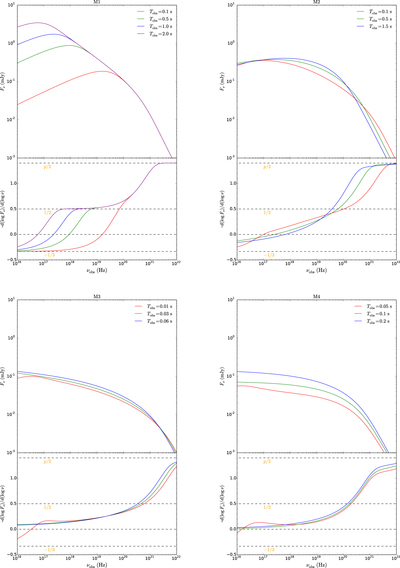
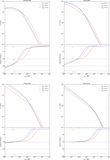
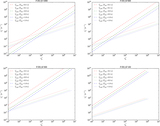
Caption: Figure 2.
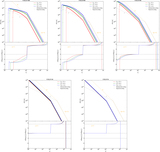
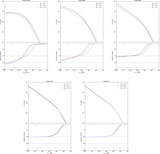
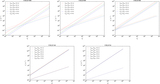
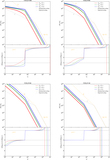
Corresponding synchrotron flux density spectra ﹩{F}_{\nu }﹩ from the electrons with the energy distribution presented in Figure 1. The lower panel of each case shows the negative local spectral indices (﹩-\alpha ﹩, ﹩{F}_{\nu }\propto {\nu }^{\alpha }﹩) of ﹩{F}_{\nu }﹩ in the upper panel. In the standard calculation, M1, it gives the typical fast-cooling spectrum ﹩{F}_{\nu }\propto {\nu }^{-1/2}﹩ below ﹩{\nu }_{{\rm{m}}}﹩ (﹩{\nu }_{{\rm{m}}}\propto {\gamma }_{{\rm{m}}}^{{\prime} 2}﹩). For an even lower frequency, the spectrum is ﹩{F}_{\nu }\propto {\nu }^{1/3}﹩, which is the profile of the low-frequency part of a single electron’s synchrotron spectrum. In other cases, the spectral indices below ﹩{\nu }_{{\rm{m}}}﹩ can be harder than ﹩-1/2﹩ and can approach zero.
Other Images in This Article
Show More
Copyright and Terms & Conditions
© 2018. The American Astronomical Society. All rights reserved.