Image Details
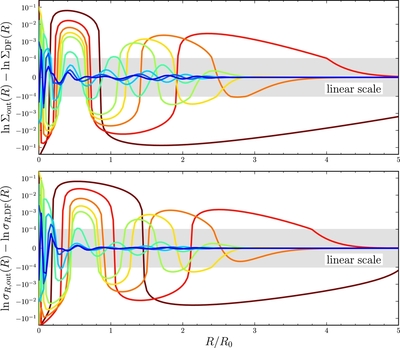
Caption: Figure 22.
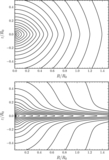
Logarithmic difference between the desired surface-density profile Σout(R) and the surface-density ΣDF(R) obtained by integrating the DF over velocity for a dehnendf in a logarithmic potential with Σout(R)∝exp (− R/(R0/3)) and σR, out(R) = 0.2 exp (− (R − R0)/R0) (top panel). The difference is shown after 1, 2, 3, 4, 5, 10, 15, 20, and 25 iterations of the correction procedure of Dehnen (1999; dark red through dark blue curves). The bottom panel shows the logarithmic difference between σR, out(R) and σR, DF(R). The y axis is logarithmic, except for the gray band. This figure shows that the correction procedure is highly effective for generating a DF that has a desired set of (Σout(R), σR, out(R)2): logarithmic differences ≲ 10−2 and ≲ 10−5 are obtained after 3 and 15 iterations, respectively.
Other Images in This Article
Show More
Copyright and Terms & Conditions
© 2015. The American Astronomical Society. All rights reserved.