Image Details
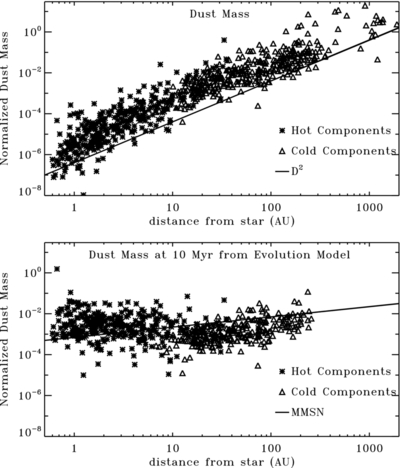
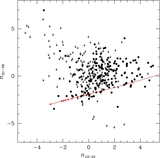
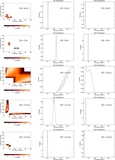
Caption: Figure 14.
Top: normalized dust mass ( M d / M *) for the warm (asterisks) and cold (triangles) components plotted as a function of dust distance ( D) for systems that are well fit using two blackbodies. Overplotted is a line showing M d / M * ∝ D 2 for comparison. Bottom: same as above using the Gáspár et al. (2013) model to estimate the dust mass at an age of ~10 Myr. Overplotted is a line showing the minimum solar-mass nebula ( M d / M * ∝ D 3/2) for comparison.
Other Images in This Article
Show More
Copyright and Terms & Conditions
© 2014. The American Astronomical Society. All rights reserved.
Copyright ©
2025 Astronomy Image Explorer. All Rights Reserved.