Image Details
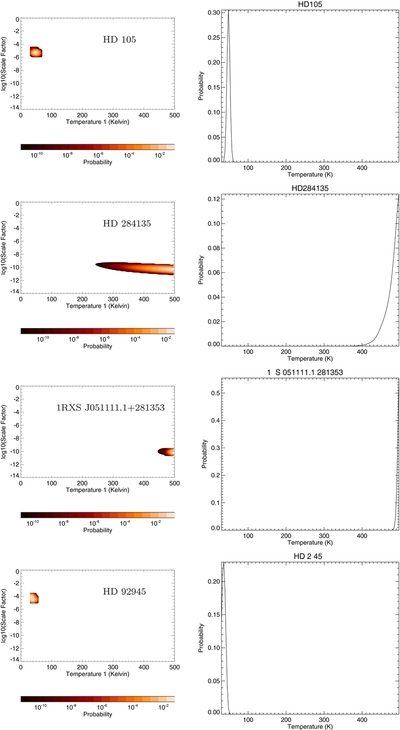
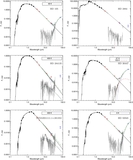
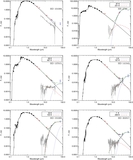
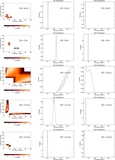
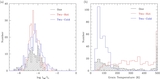
Caption: Figure 6. Contour and PDF plots for all targets that are better-fit using a single temperature black body
The complete figure set (167 images) is available in the online journal.
Left: contour plot showing probability as a function of scale factor and grain temperature for the single-temperature blackbody model for representative targets: HD 105, HD 284135, 1RXS J051111.1+281353, and HD 92945. Single-temperature blackbody models were computed on a grid with minimum and maximum grain temperatures of 30 and 500 K, respectively, and minimum and maximum log scale factors of −13.5 and −1.5, respectively. Right: grain temperature probability distribution function (pdf) for the same targets. Contour and pdf plots for all targets that are better fit using a single-temperature blackbody are available in the online journal.
Other Images in This Article
Show More
Copyright and Terms & Conditions
© 2014. The American Astronomical Society. All rights reserved.