Image Details
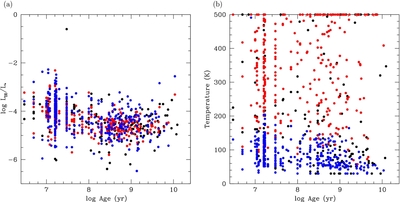
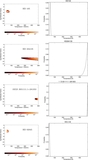
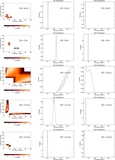
Caption: Figure 11.
(a) Fractional infrared luminosity and (b) grain temperature plotted as a function of stellar age. Objects that are better fit using a one-temperature model are plotted as black circles. Objects that are better fit using a two-temperature model are plotted as red and blue circles, representing the hot and cold components, respectively.
Other Images in This Article
Show More
Copyright and Terms & Conditions
© 2014. The American Astronomical Society. All rights reserved.
Copyright ©
2025 Astronomy Image Explorer. All Rights Reserved.