Image Details
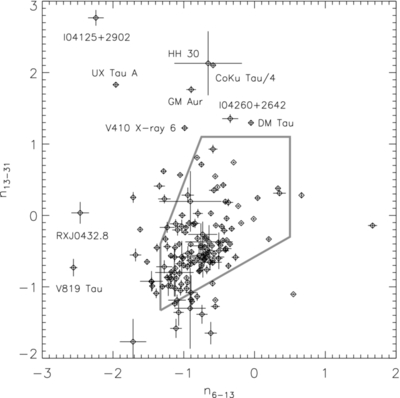
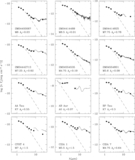
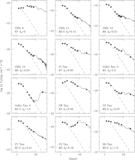
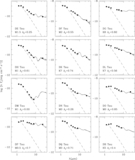
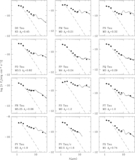
Caption: Figure 7.
Spectral index between 13 and 31 μm vs. the spectral index between 6 and 13 μm for the T Tauri stars in our sample. The polygon delineates the region of typical optically thick accretion disks (with different degrees of dust settling) as derived from models of D’Alessio et al. (2006); the grid of models can be found in Espaillat (2009).
Other Images in This Article


Show More
Copyright and Terms & Conditions
© 2011. The American Astronomical Society. All rights reserved.
Copyright ©
2025 Astronomy Image Explorer. All Rights Reserved.