Image Details
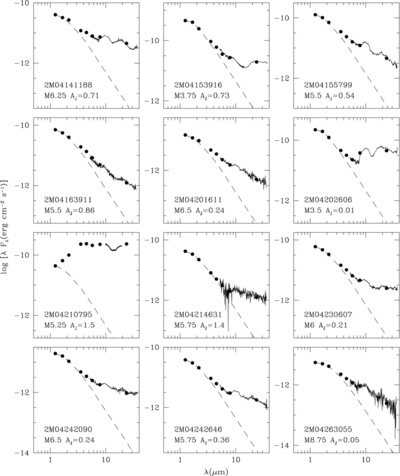
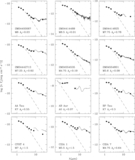
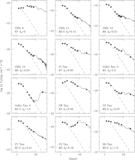
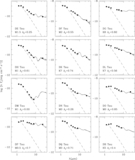
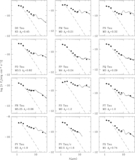
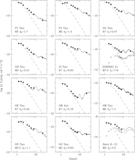
Caption: Figure 4.
SEDs for the T Tauri stars in Taurus with infrared excesses observed by IRS. The 2MASS, IRAC, and MIPS photometry is shown as filled circles, the IRS spectrum as a solid line, and the photosphere as a dashed line. For objects with A J > 2.5, we show both the observed and dereddened data (the latter with open circles and dotted lines).
Other Images in This Article

Show More
Copyright and Terms & Conditions
© 2011. The American Astronomical Society. All rights reserved.
Copyright ©
2025 Astronomy Image Explorer. All Rights Reserved.