Image Details

Caption: Figure 23.
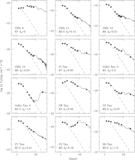
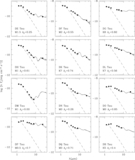
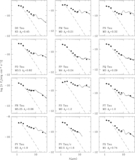
Comparison of the 6–13 μm and 13–31 μm spectral indices for models with stellar masses of 0.2 and 0.5
M
☉. For each model pair, the mass accretion rate, settling parameter
![]() , and inclination angle are the same. The dotted line represents a line with slope 1 and no offset, while the dashed line
is a linear fit to the data.
, and inclination angle are the same. The dotted line represents a line with slope 1 and no offset, while the dashed line
is a linear fit to the data.
Other Images in This Article


Show More
Copyright and Terms & Conditions
© 2011. The American Astronomical Society. All rights reserved.
Copyright ©
2025 Astronomy Image Explorer. All Rights Reserved.