Image Details
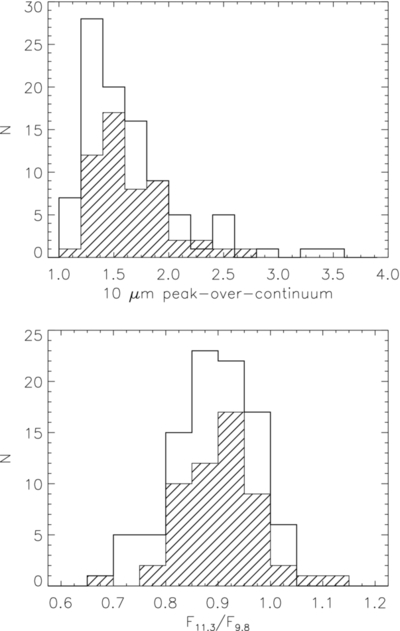
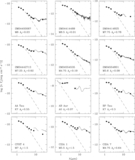
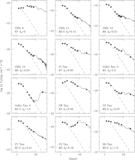
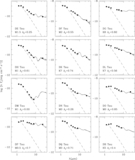
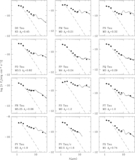
Caption: Figure 15.
Histograms for the peak-over-continuum ratio of the 10 μm silicate feature and for the 11.3 and 9.8 μm flux ratio for the single T Tauri stars in our sample (white area) and for multiple systems (shaded area).
Other Images in This Article


Show More
Copyright and Terms & Conditions
© 2011. The American Astronomical Society. All rights reserved.
Copyright ©
2025 Astronomy Image Explorer. All Rights Reserved.