Image Details
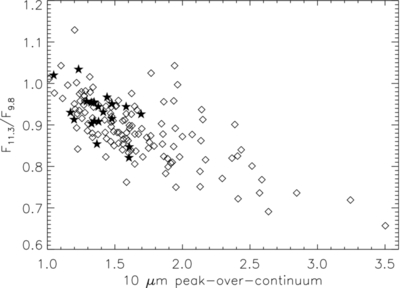
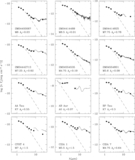
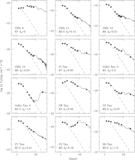
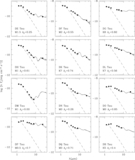
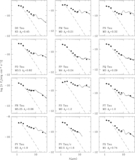
Caption: Figure 12.
Shape vs. strength of the 10 μm silicate feature for all Class II objects in our Taurus sample: the flux ratio of the continuum-subtracted and continuum-normalized spectrum at 11.3 and 9.8 μm is plotted vs. the ratio of the peak flux around 9.7 μm and the underlying continuum (see the text for details). The star symbol denotes objects with spectral type M6 or later.
Other Images in This Article


Show More
Copyright and Terms & Conditions
© 2011. The American Astronomical Society. All rights reserved.
Copyright ©
2025 Astronomy Image Explorer. All Rights Reserved.