Image Details
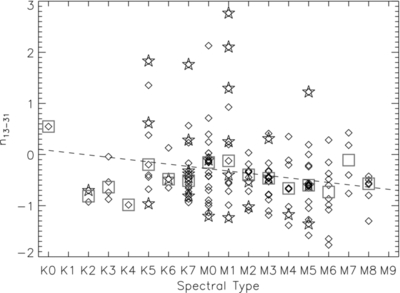
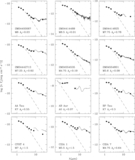
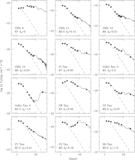
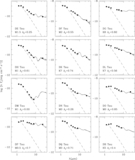
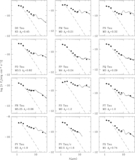
Caption: Figure 11.
Spectral index between 13 and 31 μm vs. the spectral type for the T Tauri stars in our sample. The star symbols have the same meaning as in Figure 10. Squares are plotted at the median n 13 − 31 value for each spectral type. The dashed line represents a linear fit to the data shown.
Other Images in This Article


Show More
Copyright and Terms & Conditions
© 2011. The American Astronomical Society. All rights reserved.
Copyright ©
2025 Astronomy Image Explorer. All Rights Reserved.