Image Details

Caption: Figure 48.
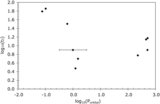
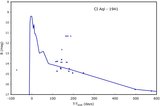
V394 CrA folded and binned light curve for the 1989 and 2005 data only. V394 CrA has a highly significant photometric modulation (with a period of 0.757841 ± 0.000004 days) superposed on a light curve that rises and falls on a much longer time scale. The modulation is most prominent when the system is faintest, as in the years 1989 and 2005. The stability of this periodicity from 1989 to 2008 implies that the modulation is associated with the orbital period. But P orb might be twice this value, because the odd and even maxima and minima are at different levels. In an effort to subtract out the extra (non-periodic) flux, I have taken the B-band and R-band magnitudes from Table 22 and subtracted out average magnitudes over 40-day bins, and then added 19. This figure displays a folded and binned light curve for a period of 1.515682 days for just the data of 1989 and 2005. The primary minimum (at phase zero) is deeper than the secondary minimum (at phase half), while the maximum after the primary minimum is brighter than the maximum after the secondary minimum. The light curve displays little variability between phases 0.1 and 0.6 and substantial variability between phases 0.6 and 1.1, with this being a clue to the position of the source and directionality of the source of the flickering.
Other Images in This Article
Show More
Copyright and Terms & Conditions
© 2010. The American Astronomical Society. All rights reserved.