Image Details
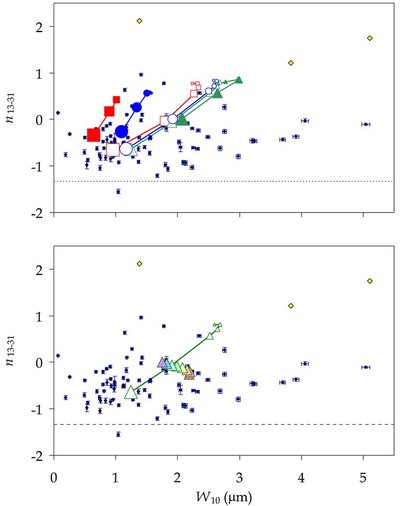
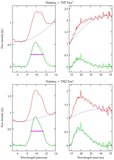
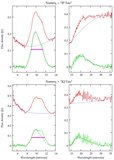
Caption: Figure 8.
Dependence of n 13 − 31 and W 10 in our sample of Class II YSOs (blue diamonds), compared to that of the YSO disk models by d’Alessio et al. (2006). Data for the transitional disks CoKu Tau/4, DM Tau, and GM Aur are plotted with yellow-centered symbols. A dotted line at n 13 − 31 = −4/3, as obtained for a geometrically thin, opaque passive disk, indicates the extreme of sedimentation. In the models plotted in the upper panel, small interstellar-like grains are assumed to populate the disk around stars of mass 0.4 (squares), 0.5 (triangles), and 0.8 M ☉ (circles), with disk accretion rates of 10 −9 (open symbols) and 10 −8 M ☉yr −1 (filled symbols); the disk axis is oriented by i = 45° with respect to the line of sight, and the dust settling parameter ε—the depletion factor with respect to gas for dust in the upper layers of the disk—is 0.001, 0.01, 0.1, 0.2, 0.5, and 1 (large to small symbols). To illustrate the effect of a range of disk orientation, the upper panel's model track for M = 0.5 M ☉ and dM/ dt = 10 −9 M ☉ yr −1is reproduced in the lower panel, along with the model results for these parameters, ε = 0.01, and i = 12°, 17°, 24°, 30°, 37°, 45°, 53°, and 64° (light red to light violet centers). Note that the models for disks with smallest ε all predict n 13 − 31 and W 10 values corresponding to the densest concentration of data points. Note also that for increasing ε, the models form tracks radiating from this dense concentration along positive slopes to encompass most of the rest of the data points.
Other Images in This Article
Show More
Copyright and Terms & Conditions
© 2009. The American Astronomical Society. All rights reserved.