Image Details
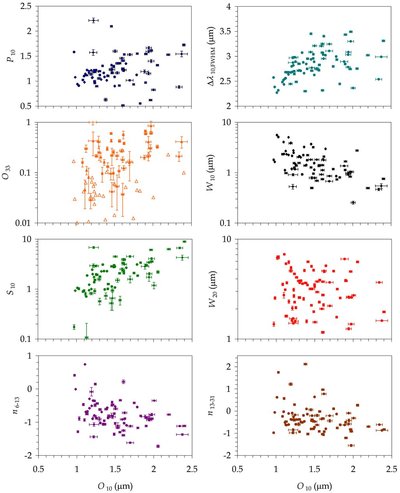
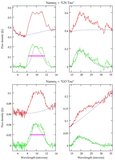
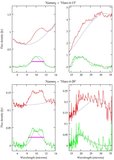
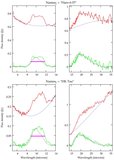
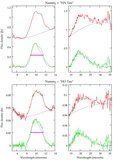
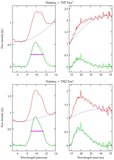
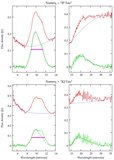
Caption: Figure 7.
Trends among the emission features and their crystalline indices. Plotted are indices derived from features of pyroxene, olivine and silica ( P 10, O 33, and S 10, respectively), the full width at half-maximum of the 10 μm silicate complex (Δλ 10), the equivalent widths of the 10 and 20 μm silicate complexes ( W 10 and W 20), and two of the continuum spectral indices ( n 6 − 13 and n 13 − 31),all plotted as functions of the olivine index O 10. Upper limits are indicated by open symbols.
Other Images in This Article
Show More
Copyright and Terms & Conditions
© 2009. The American Astronomical Society. All rights reserved.
Copyright ©
2025 Astronomy Image Explorer. All Rights Reserved.