Image Details
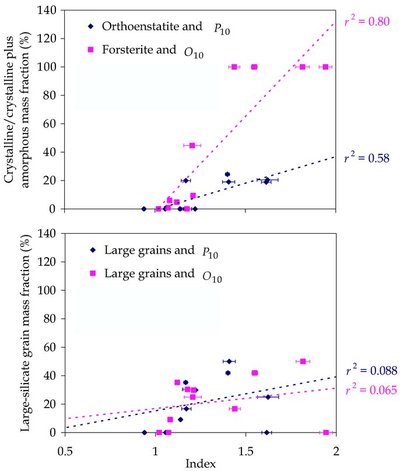
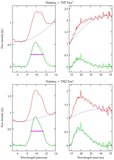
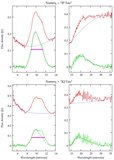
Caption: Figure 4.
Relation between the crystalline-silicate indices, and the mass fractions of the corresponding crystalline minerals (upper) and amorphous large-grain material (lower), determined from the same spectra by fitting laboratory spectra (Sargent et al. 2006). The blue diamonds indicate the P 10 index and orthoenstatite, and the magenta squares the O 10 index and forsterite. The quality of linear fits to the data is indicated by the square of the linear correlation coefficient, r 2 (see below, Equation 4).
Other Images in This Article
Show More
Copyright and Terms & Conditions
© 2009. The American Astronomical Society. All rights reserved.
Copyright ©
2025 Astronomy Image Explorer. All Rights Reserved.