Image Details
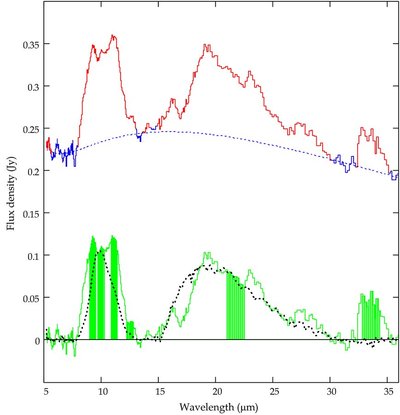
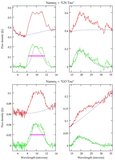
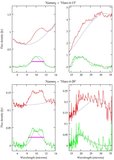
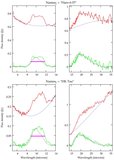
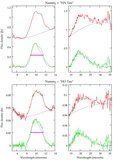
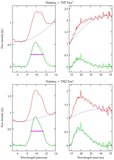
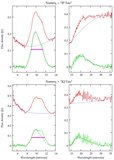
Caption: Figure 3.
Outline of the crystalline-silicate index extraction, using the spectrum of IS Tau as an example. In each frame is a calibrated spectrum, baseline fit, equivalent width per channel, and composite pristine spectrum, presented in the same manner as in Figure 2. The green bars are the bands within which the equivalent width per channel is summed for the indices centered at 9.2, 9.9, 11.1, 12.5, 21.7 and 33.6 μm, reading from left to right.
Other Images in This Article
Show More
Copyright and Terms & Conditions
© 2009. The American Astronomical Society. All rights reserved.
Copyright ©
2025 Astronomy Image Explorer. All Rights Reserved.