Image Details
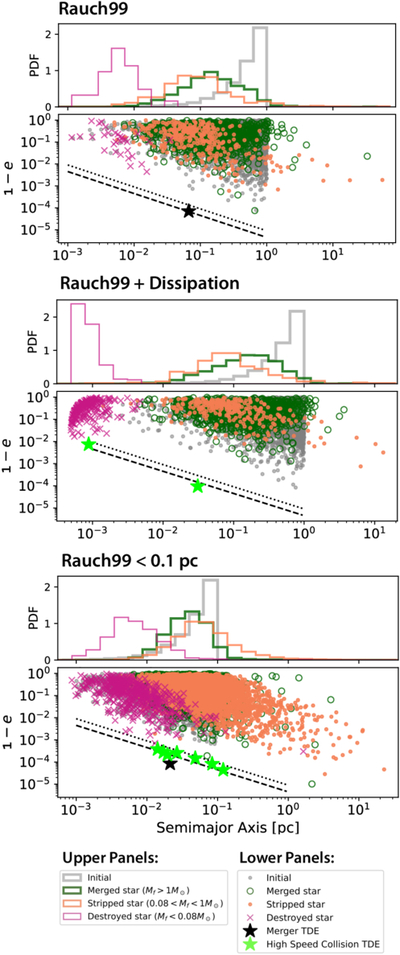
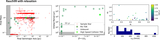
Caption: Figure 3.
This figure shows semimajor axis vs. 1 − e, a quantity proportional to the periapsis distance, of the sample stars from the first three rows of Figure 2. Systems with ef > 1 (unbound orbits) are omitted, as are uncollided stars, whose properties cannot change without two-body relaxation. In the bottom panel of each plot, gray dots represent the initial population. Stars with M > 1 M⊙, represented by green circles, must have experienced a merger. Orange dots are stripped stars (0.08 M⊙ < M < 1 M⊙), indicative of a high-speed collision. Destroyed stars (M < 0.08 M⊙) are marked with pink crosses. TDEs are marked using the same conventions as in Figure 2 and lie on nearly radial orbits with extreme eccentricity values. To guide the eye, we plot the full (partial) disruption radii for a 1 M⊙ star in dashed (dotted) black lines. The upper panel of each plot shows a histogram of the spatial distribution of these subpopulations in the same color scheme as the scatter plot.
Other Images in This Article

Copyright and Terms & Conditions
© 2025. The Author(s). Published by the American Astronomical Society.