Image Details
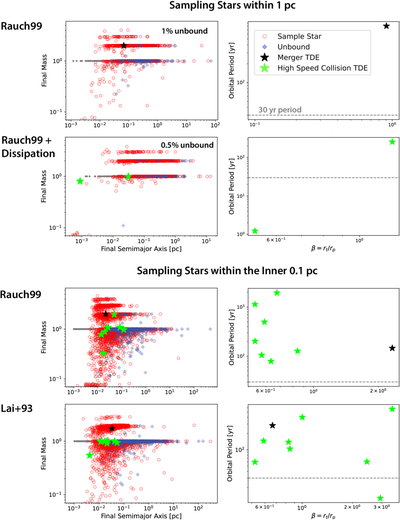
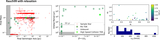
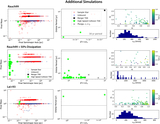
Caption: Figure 2.
Left column: we show the final masses of our sample stars vs. their final distances from the SMBH for four select simulations without relaxation, allowing us to isolate the effect of collisions. The final mass and distance are the star's properties either when it evolved off the main sequence or at the end of the 10 Gyr integration time, whichever is shorter. The gray points are the initial conditions, while red circles are the final sample stars that remained in the cluster. Blue diamonds denote stars that escaped from the cluster, and black and lime stars represent TDEs from different types of collisions, mergers and high-speed collision deflections, respectively. In the upper right corner, we indicate the percentage of stars that became unbound orbits. Since unbound orbits have a negative semimajor axis, here we plot the absolute value for their final orbits. Right column: we show the orbital period of the stars when they become TDEs vs. β, the ratio of the tidal radius to the orbit’s periapsis. The gray dashed horizontal line marks 30 yr, approximately the threshold below which we could conceivably observe multiple passages. Rows: each row corresponds to different initial conditions or collision treatment. The first row uses the Rauch99 prescription for mergers and mass loss. The second row is identical to the above except we always reduce the postcollision speed in the center-of-mass frame by 10% for high-speed collisions. The third and fourth rows use Rauch99 and Lai+93 fitting formulae, respectively. These are higher-resolution “zoom-in” simulations where the stars have been sampled on a cusp from 0.001 to 0.1 pc. In this radius range, the collision timescale becomes comparable to the lifetime of a solar mass star, and increasing our resolution in this range allows us to follow rarer events, such as merger TDEs.
Other Images in This Article
Copyright and Terms & Conditions
© 2025. The Author(s). Published by the American Astronomical Society.