Image Details
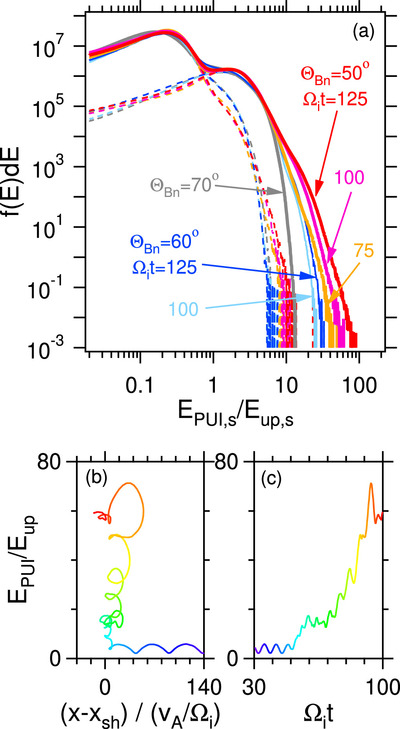
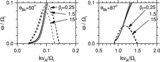
Caption: Figure 4.
(a) Energy distributions of downstream PUIs at various shock angles and times. Each distribution (solid line) is divided into the two dashed lines indicating SWIs (lower energy) and PUIs (higher energy). Energy history of an accelerated PUI is shown by the rainbow colored lines as a function of (b) space and (c) time. The line color denotes time.
Other Images in This Article
Copyright and Terms & Conditions
© 2024. The Author(s). Published by the American Astronomical Society.
Copyright ©
2025 Astronomy Image Explorer. All Rights Reserved.