Image Details
Caption: Figure 2.
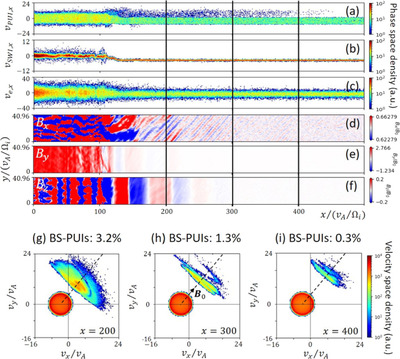
Particle distribution and magnetic fields upstream of the shock at t = 65 (Θ Bn = 50°). From the top, V x − x phase-space distributions of (a) PUIs, (b) SWIs, (c) electrons; magnetic field components of (d) B x , (e) B y , (f) B z ; and velocity distributions of PUIs at (g) x = 200, (h) x = 300, and (i) x = 400. In panels (a)–(c) and (g)–(i), only the particles at y ≈ L y /2 are counted. The color bars in panels (a)–(c) denote phase-space density (in an arbitrary unit). The color bar in panels (g)–(i) denotes velocity space density (in an arbitrary unit). The dashed lines in panels (g)–(i) represent the direction of local (upstream) magnetic field, B 0.
Other Images in This Article
Copyright and Terms & Conditions
© 2024. The Author(s). Published by the American Astronomical Society.