Image Details
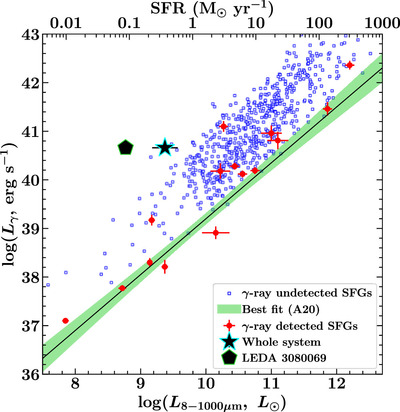
Caption: Figure 4.
This plot shows the γ-ray luminosity as a function of infrared luminosity for γ-ray-detected (red circles) and undetected (blue squares) star-forming galaxies. For Fermi-LAT undetected sources, the γ-ray luminosities are upper limits. The black solid line and green shaded region refer to the best-fitted correlation and 1σ uncertainty, respectively, reported by Ajello et al. (2020). The location of “Kathryn’s Wheel” system is shown with a black star. The black pentagon shows the case when all of the γ-ray emission is considered to be originating from the dwarf galaxy LEDA 3080069 alone.
Other Images in This Article
Copyright and Terms & Conditions
© 2024. The Author(s). Published by the American Astronomical Society.
Copyright ©
2025 Astronomy Image Explorer. All Rights Reserved.