Image Details
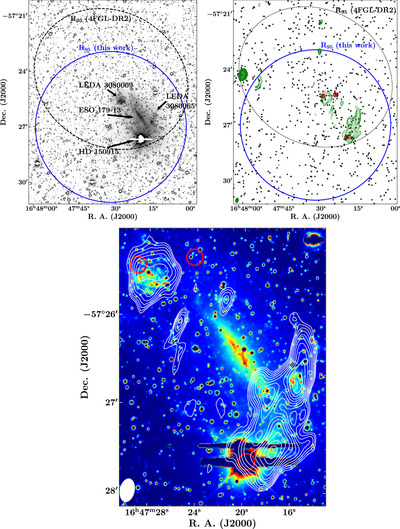
Caption: Figure 1.
Top left: DECAM g-band image of “Kathryn’s Wheel.” The brightest pixels were masked, and the color scale was adjusted to enhance the faint features. Top right: Swift-XRT counts map of the same region. The red circles represent the identified X-ray sources and have a radius of 5.″6, estimated as the positional uncertainty in the optimized X-ray positions. The green contours refer to the 1.36 GHz emission observed by RACS. The contours start at three×rms and increase in the multiple of ﹩\sqrt{1.5}﹩. Bottom: the same as the top panels but zooming in on the system. Here, we have used DECAM VR-band data with a longer exposure than the g-band image. The radio contours are shown in white for clarity. North is up and east to the left.
Other Images in This Article
Copyright and Terms & Conditions
© 2024. The Author(s). Published by the American Astronomical Society.