Image Details
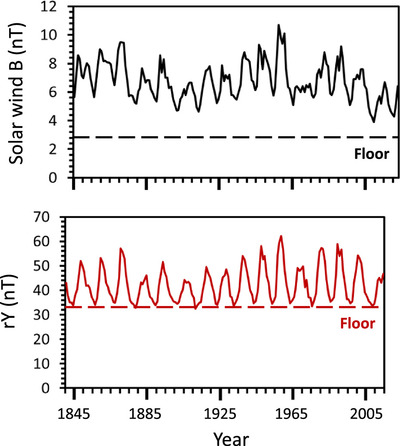
Caption: Figure 4.
Top panel: annual solar wind B values (1845–2022; Owens et al. 2016) with a ∼2.8 nT floor indicated. Bottom panel: composite annually averaged diurnal geomagnetic variation rY showing the return to a ∼33 nT floor at each solar minimum from 1840 to 2014 (Svalgaard 2016).
Other Images in This Article


Copyright and Terms & Conditions
© 2024. The Author(s). Published by the American Astronomical Society.
Copyright ©
2025 Astronomy Image Explorer. All Rights Reserved.